Geographic Region Codes Explained: NUTS, FIPS, ISO 3166 & More
A complete guide to statistical region codes used in data visualization – NUTS, FIPS, ISO 3166 and global standards explained with examples.

 Manuel Rossner
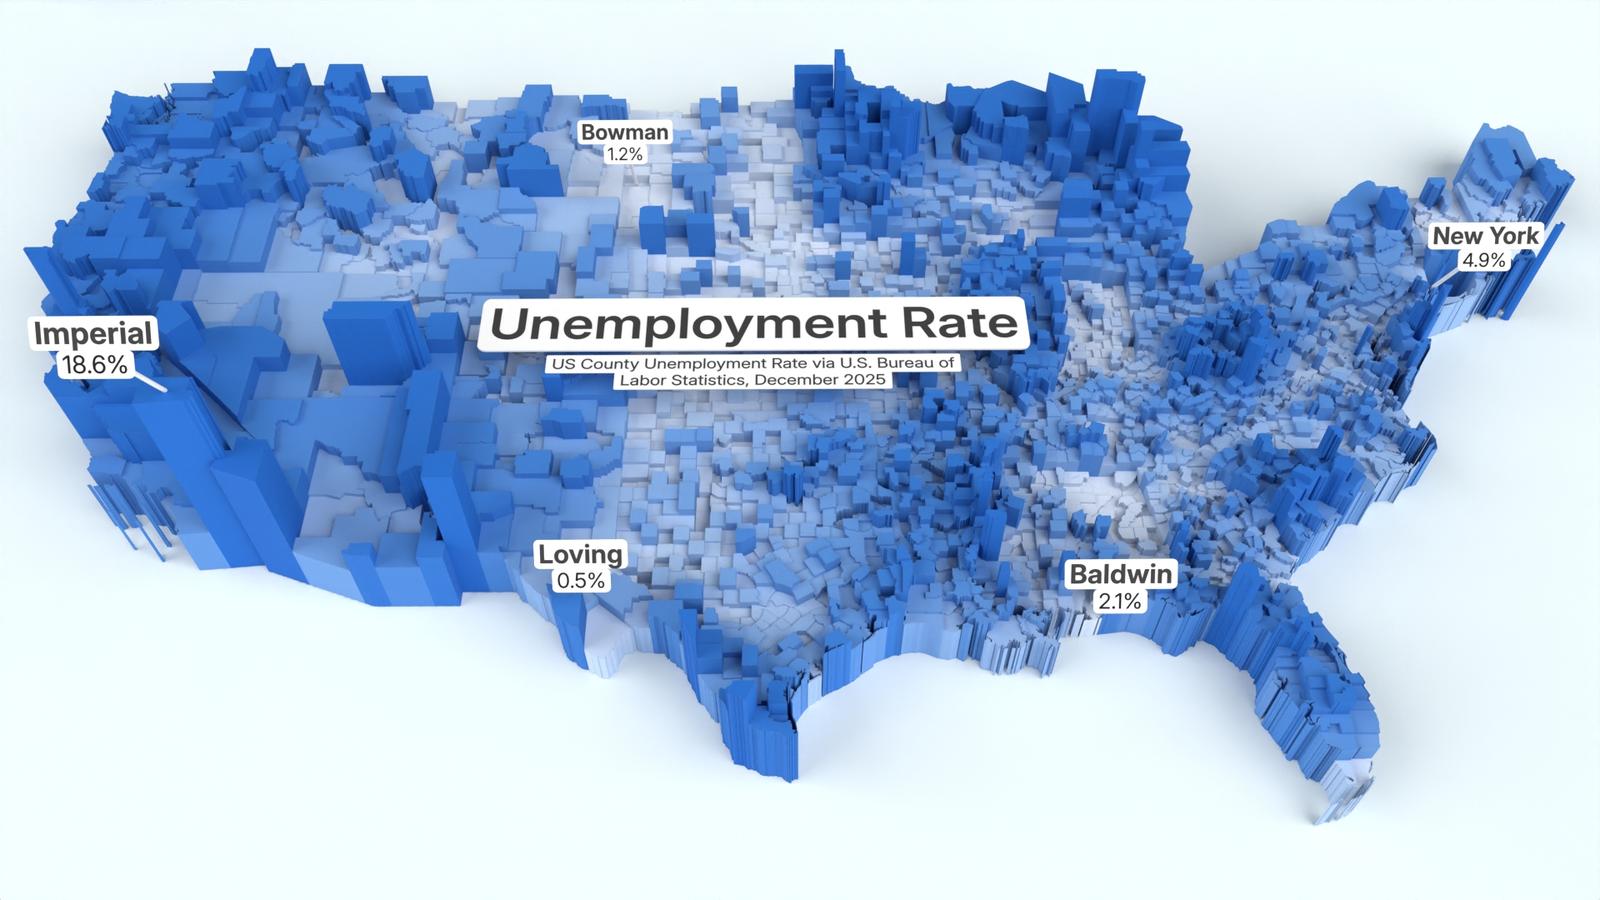
A complete guide to statistical region codes used in data visualization – NUTS, FIPS, ISO 3166 and global standards explained with examples.
Manuel RossnerAnyone who has worked with geographic data has run into the same problem: your dataset says "DE21" or "06037" or "US-CA", and you need to put that on a map. These aren't random strings — they're standardized region codes, and understanding them is the difference between a clean visualization and hours of debugging mismatched data.
This guide covers the major geographic coding systems used in data analysis, journalism, and policy research. We explain what each standard covers, how the codes are structured, and where they apply — so you can match your data to the right boundaries.
Geographic region codes are standardized identifiers assigned to administrative or statistical areas. They exist because place names are ambiguous — "Georgia" is both a US state and a country, "Valencia" is a city and a region — but codes are unique.
These coding systems serve several purposes:
For anyone building maps or geographic visualizations, region codes are the glue between raw data and rendered polygons.
The Nomenclature of Territorial Units for Statistics (NUTS) is the EU's hierarchical system for dividing up European territory. Maintained by Eurostat, it covers all EU member states plus EEA countries (Iceland, Liechtenstein, Norway) and the United Kingdom (which retains a NUTS-equivalent classification called ITL).
NUTS has four levels, each nesting inside the one above:
| Level | What it represents | Example | Typical entity |
|---|---|---|---|
| NUTS 0 | Country | DE | Germany |
| NUTS 1 | Major socio-economic region | DE2 | Bavaria |
| NUTS 2 | Basic region for policy | DE21 | Oberbayern (Upper Bavaria) |
| NUTS 3 | Small region / district | DE212 | München, Kreisfreie Stadt |
The code structure is strictly hierarchical: each level appends one character to its parent. This means you can roll data up or drill down just by truncating or extending the code string.
NUTS codes are revised roughly every three years. The current classification used in most official statistics is NUTS 2024, though some datasets (particularly for the UK) still reference NUTS 2021. When working with time series data, pay attention to which NUTS vintage your boundaries reflect — regions do get merged, split, or renamed between revisions.
NUTS is the standard for virtually all EU-level statistical data: regional GDP, unemployment rates, population density, election results, cohesion fund allocations, and more. If you're visualizing European regional data from Eurostat, the OECD, or national statistics offices, it will almost certainly be keyed to NUTS codes.
The geographic boundaries are published as open data by Eurostat's GISCO service in GeoJSON and other formats, at multiple scales from 1:60M (overview) to 1:1M (high detail).
28 EU/EEA countries plus the UK — approximately 1,500 regions at NUTS 3 level. NUTS does not cover non-European countries.
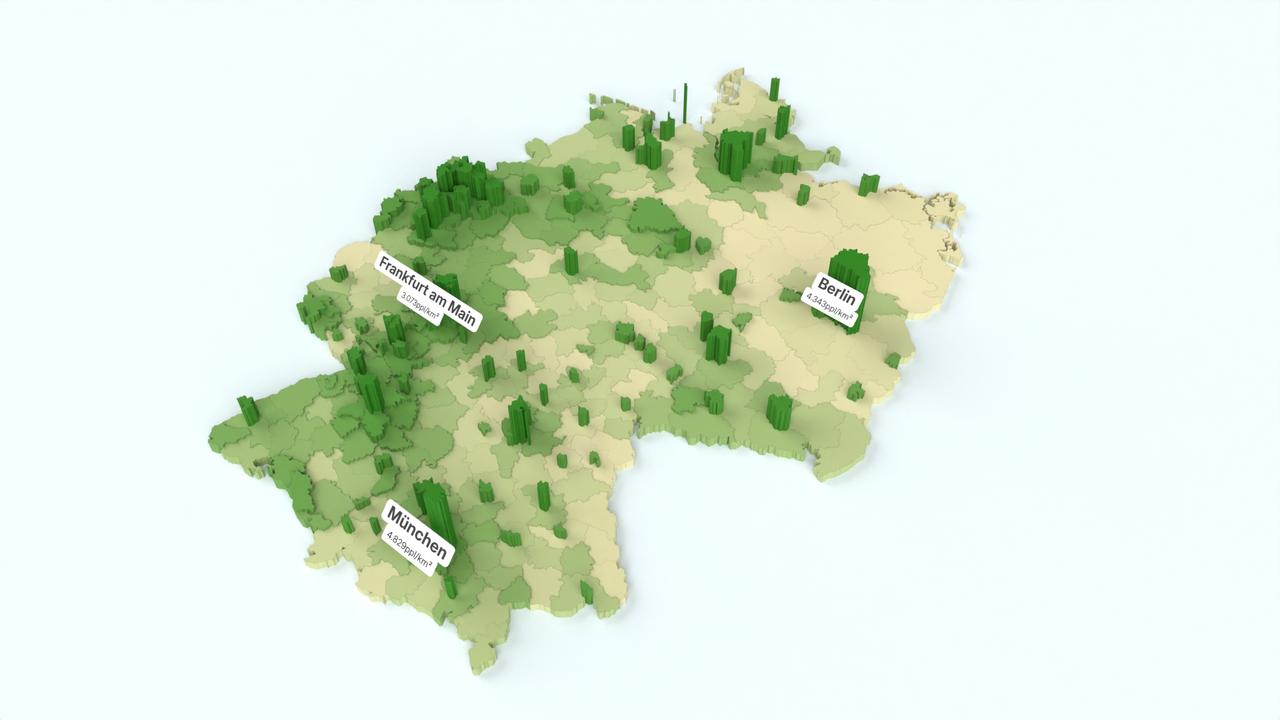
FIPS codes (Federal Information Processing Standards) are numeric identifiers for US geographic entities. While NIST officially withdrew the FIPS 6-4 standard in 2008, the codes remain ubiquitous in practice. The US Census Bureau, CDC, USDA, BLS, and most federal agencies still publish data with FIPS codes.
| Level | Format | Example | Entity |
|---|---|---|---|
| State | 2 digits | 06 | California |
| County | 5 digits (state + county) | 06037 | Los Angeles County, CA |
The first two digits of a county FIPS code identify the state. This means you can group counties by state simply by looking at the first two characters — similar to the NUTS hierarchy, but numeric rather than alphanumeric.
Some things to watch out for:
01, not 1. Many spreadsheet applications strip leading zeros from numeric columns, silently breaking FIPS joins. Always import FIPS codes as text.Any US dataset published at the county level almost certainly uses FIPS codes: public health data (CDC), agricultural data (USDA), economic data (BLS, BEA), election results, and Census demographics. FIPS is also the standard linking mechanism for TIGER/Line shapefiles from the US Census Bureau.
50 US states, DC, and US territories. Approximately 3,200 counties and county-equivalents.
ISO 3166 is the international standard for country codes and their subdivisions. It's maintained by the ISO and is the closest thing to a universal geographic coding system.
ISO 3166-1 defines country codes in three formats:
| Format | Example | Usage |
|---|---|---|
| Alpha-2 | DE | Most common — used in domain names, currency codes, language tags |
| Alpha-3 | DEU | More readable — common in datasets and international reporting |
| Numeric | 276 | Language-independent — used in systems that can't handle letters |
ISO 3166-2 defines subdivision codes (states, provinces, regions) using the pattern {country}-{subdivision}:
| Example | Entity |
|---|---|
US-CA | California, United States |
JP-13 | Tokyo, Japan |
BR-SP | São Paulo, Brazil |
CN-31 | Shanghai, China |
This is the standard used by most global datasets when referencing first-level administrative divisions outside of Europe (where NUTS is preferred) and the US (where FIPS dominates at county level).
ISO 3166-3 covers formerly used country codes (e.g., SUHH for the Soviet Union, CSXX for Serbia and Montenegro). Relevant mainly for historical datasets.
Everywhere. ISO 3166-1 is the de facto standard for identifying countries in almost any international context — the UN, World Bank, WHO, WTO, and every major data provider use it. ISO 3166-2 is increasingly used for subnational data, particularly in datasets that span multiple countries.
249 countries and territories (ISO 3166-1). Over 5,000 subdivisions worldwide (ISO 3166-2).
The United Nations Statistics Division maintains UN M49, a system of three-digit numeric codes for countries and — uniquely — for supranational groupings that don't exist in ISO 3166.
M49 defines macro-geographic regions and sub-regions:
| Code | Entity | Type |
|---|---|---|
150 | Europe | Region |
155 | Western Europe | Sub-region |
276 | Germany | Country |
The country-level codes in M49 are identical to ISO 3166-1 numeric codes. The value of M49 is the groupings above country level: it defines what "Sub-Saharan Africa", "South-Eastern Asia", or "Latin America and the Caribbean" actually includes. These groupings are used extensively in UN publications and development data.
UN agencies, the World Bank, and development-focused organizations. If you need to aggregate country-level data into world regions, M49 is the standard taxonomy. It's also useful for building choropleth maps that color-code entire continents or sub-regions.
All UN member states, plus non-member states and territories. Regional groupings cover the entire world.
GADM is an open dataset of administrative boundaries for every country in the world, down to fine-grained local levels (up to admin level 5 in some countries). It uses its own ID system (GADM_ID), not a formal standard, but it's one of the most complete open sources for subnational boundaries globally. Useful when you need boundaries that ISO or NUTS don't cover — for example, districts in India or municipalities in Brazil.
OpenStreetMap encodes administrative boundaries with admin_level tags (1–10), where the meaning of each level varies by country. OSM boundaries are community-maintained, which means coverage is uneven — excellent in Europe and North America, patchy in parts of Africa and Central Asia. The Overture Maps Foundation publishes a curated, quality-controlled extract of OSM-derived administrative divisions that's more suitable for analytical use.
Geographic coding systems sometimes reflect political positions. Taiwan has an ISO 3166-1 code (TW / TWN) but its status is contested. Kosovo uses XK by convention but doesn't have a formal ISO 3166-1 assignment. Palestine uses PS / PSE. If your visualization covers disputed territories, be aware that the choice of boundary data is itself a statement. Different sources may draw borders differently.
| Standard | Geographic scope | Levels | Code example | Best for |
|---|---|---|---|---|
| NUTS | EU + EEA + UK | 4 (country → district) | DE212 | European regional statistics |
| FIPS | United States | 2 (state → county) | 06037 | US county-level data |
| ISO 3166-1 | Worldwide | 1 (country) | DEU / DE | Any international dataset |
| ISO 3166-2 | Worldwide | 1 (subdivision) | US-CA, JP-13 | Global subnational data |
| UN M49 | Worldwide | 3 (region → country) | 155 | Supranational groupings |
| GADM | Worldwide | Up to 5 | DEU.2.8_1 | Fine-grained local boundaries |
In practice, most projects use a combination. A global dataset might use ISO 3166-1 for countries, NUTS for European drill-down, and FIPS for US county detail. The challenge is matching the right code system to the right boundary files — and handling the inevitable cases where datasets mix standards or use outdated code vintages.
Mapping region codes to static images is well-trodden ground. Turning them into animated visualizations — where regions light up over time, values shift across a color scale, and the camera moves — is a different challenge entirely.
Traditional tools require you to either write custom code (D3.js, Mapbox GL, deck.gl) and then screen-record the result, or use desktop GIS software that was never designed for animation. Both approaches work but demand significant technical effort and rarely produce broadcast-quality output.
Hydrant takes a different approach. It supports NUTS, FIPS, and ISO 3166 region codes natively — upload a spreadsheet with a region code column and a value column, and it matches your data to high-resolution boundaries automatically. From there, you can produce animated map videos with smooth transitions, camera movements, and cinematic lighting, rendered in the cloud at up to 4K resolution.
If you work with regional data and need to turn it into something people actually want to watch, try it in the studio or check the pricing.